Tiedosto:Involutes of a cubic curve.svg

Alkuperäinen tiedosto (SVG-tiedosto; oletustarkkuus 1 440 × 1 440 kuvapistettä; tiedostokoko 59 KiB)
| Tämä tiedosto on tiedostotietokanta Wikimedia Commonsista. Tiedot kuvaussivulta näkyvät alla. |  |
Tiedoston kuvaussivu Commonsissa |
Yhteenveto
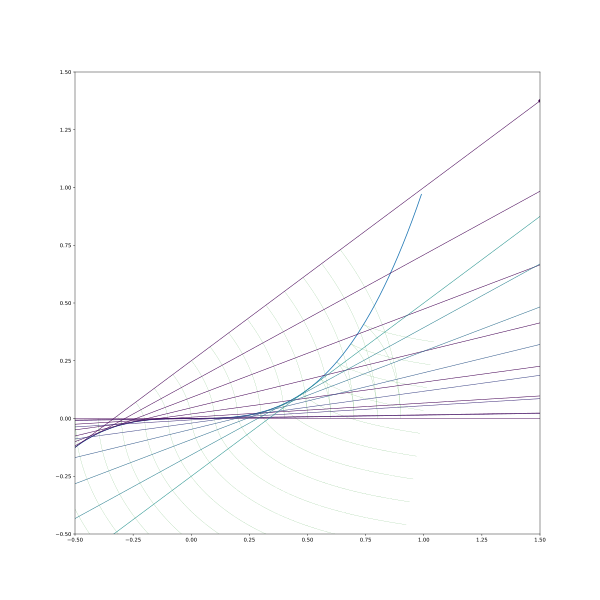
| Kuvaus |
English: ```python
import numpy as np import matplotlib.pyplot as plt from scipy.integrate import quad # numerical integration import matplotlib.cm as cm # for colormaps def involute(f, df, x0, l0, dxs): """
f: the function that produces the curve
df: the derivative. That is, df(x) = f'(x)
x0: the origin point
l0: the string length at origin point
dxs: the differential points at which to plot the involute.
Assumed to be sorted in increasing order
returns f_xs, f_ys, inv_xs, inv_ys
"""
f_xs = x0 + dxs
f_ys = f(f_xs)
inv_xs = np.zeros(len(dxs))
inv_ys = np.zeros(len(dxs))
arclength_integrand = lambda x: np.sqrt(1 + df(x)**2)
for i in range(len(dxs)):
x = x0 + dxs[i]
arclength = quad(arclength_integrand, x0, x)[0]
string_length = l0 - arclength
string_angle = np.arctan(df(x))
inv_xs[i] = f_xs[i] + string_length * np.cos(string_angle)
inv_ys[i] = f_ys[i] + string_length * np.sin(string_angle)
return f_xs, f_ys, inv_xs, inv_ys
def plot_line(x, y, slope, dxmin, dxmax, **kwargs): plt.plot([x+dxmin, x+dxmax], [y+dxmin*slope, y+dxmax*slope],
**kwargs)
f = lambda x: x**3 df = lambda x: 3 * x**2 f_xs, f_ys, inv_xs, inv_ys = involute(f, df, 0, l0=0.8, dxs=np.arange(200) / 100 - 1) y_x_ratio = 1 plt.figure(figsize=(16, int(16*y_x_ratio))) plt.plot(f_xs, f_ys) for l0 in np.arange(20)/10-1: f_xs, f_ys, inv_xs, inv_ys = involute(f, df, 0, l0=l0, dxs=np.arange(200) / 100 - 0.5) plt.plot(inv_xs, inv_ys, color='green', linewidth=0.2) for x in np.linspace(-0.5, 0.5, 15): y = f(x) slope = df(x) plot_line(x, y, slope, -1, +2, color=cm.viridis(x), marker='o',markersize=5, linewidth=1) xlim_low = -0.5 xlim_width = 2 ylim_low = -0.5 plt.xlim(xlim_low, xlim_low + xlim_width) plt.ylim(ylim_low, ylim_low + xlim_width * y_x_ratio) plt.savefig("involutes of a cubic curve.svg") plt.show() ``` |
| Päiväys | |
| Lähde | Oma teos |
| Tekijä | Cosmia Nebula |
Lisenssi
- Voit:
- jakaa – kopioida, levittää ja esittää teosta
- remiksata – valmistaa muutettuja teoksia
- Seuraavilla ehdoilla:
- nimeäminen – Sinun on mainittava lähde asianmukaisesti, tarjottava linkki lisenssiin sekä merkittävä, mikäli olet tehnyt muutoksia. Voit tehdä yllä olevan millä tahansa kohtuullisella tavalla, mutta et siten, että annat ymmärtää lisenssinantajan suosittelevan sinua tai teoksen käyttöäsi.
- jaa samoin – Jos muutat tai perustat tähän työhön, voit jakaa tuloksena syntyvää työtä vain tällä tai tämän kaltaisella lisenssillä.
Tiedoston historia
Päiväystä napsauttamalla näet, millainen tiedosto oli kyseisellä hetkellä.
| Päiväys | Pienoiskuva | Koko | Käyttäjä | Kommentti | |
|---|---|---|---|---|---|
| nykyinen | 4. syyskuuta 2023 kello 09.07 | | 1 440 × 1 440 (59 KiB) | Cosmia Nebula | Uploaded while editing "Involute" on en.wikipedia.org |
Tiedoston käyttö
Seuraava sivu käyttää tätä tiedostoa:
Tiedoston järjestelmänlaajuinen käyttö
Seuraavat muut wikit käyttävät tätä tiedostoa:
- Käyttö kohteessa en.wikipedia.org