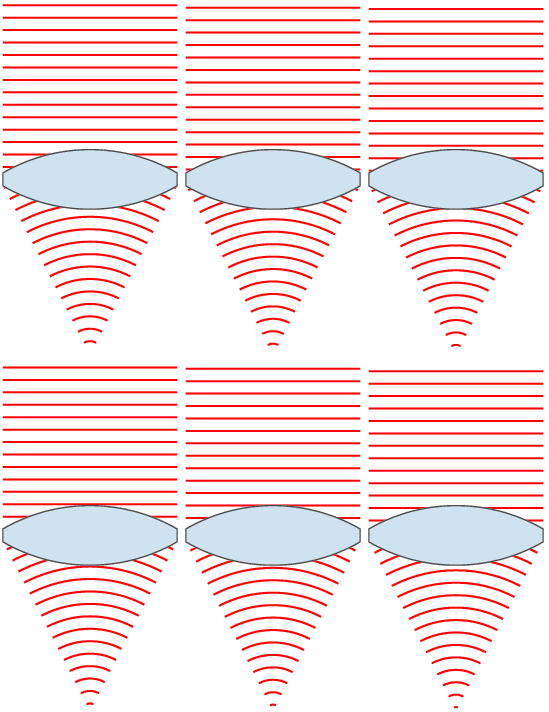
Tiedosto:Lens and wavefronts.gif

Wikipediasta
Siirry navigaatioon Siirry hakuun

Lens_and_wavefronts.gif(183 × 356 kuvapistettä, 35 KiB, MIME-tyyppi: image/gif, toistuva, 9 kehystä, 0,7 s)

slnglelens

Yhteenveto

Kuvaus Illustration of wavefronts after passing through a lens. Interestingly, to produce a point source reverse the direction of the waves, with the focus point acting as a point source.
Päiväys (UTC)
Lähde self-made with MATLAB
Tekijä Oleg Alexandrov
Muut versiot
 
Tämä GIF tietokonegrafiikka luotiin käyttäen apuna ohjelmaa MATLAB.

Lisenssi

Public domain Minä, tämän teoksen tekijänoikeudellinen omistaja, julkaisen tämän teoksen public domainiin eli luovun kaikista tekijänoikeuksista lain sallimissa puitteissa. Tämä on voimassa maailmanlaajuisesti.
Joissain maissa laki ei mahdollista tätä. Mikäli näin on:
Myönnän kenelle tahansa oikeuden käyttää tätä teosta mihin tahansa tarkoitukseen, ilman mitään ehtoja, ellei laki vaadi ehtojen asettamista.

siingleline

% Illustration of planar wavefronts going through a lens and getting focused
% into a converging spherical wave

function main ()

  % lens index
   n=1.5; 

  % number of points, used for plotting
   N = 100;

  % radii of lens surfaces
   R1 = 0.5; 
   R2 = 1.5;

  % centers of circles (y coord is 0)
   O1 = -2.9;
   O2 = -O1;

  % focal length
   f = (n-1)*(1/R1+1/R2); f = 1/f;
   
   % theta0 determines the width of the lens
   theta0=pi/6;
   Theta = linspace(-theta0, theta0, N);

  % right face of the lens
   L1x = R1*cos(Theta)+O1;
   L1y =R1*sin(Theta); 

   % left size of the lens
   L2x=-R2*cos(Theta)+O2;
   L2y = R2*sin(Theta);

   % flat top part
   Topx = [L1x(N), L2x(N)];
   Topy = [L1y(N), L2y(N)];

   % flat bottom part
   Botx = [L1x(1) L2x(1)];
   Boty = [L1y(1), L2y(1)];

   % the lens
   Lensx = [L1x rv_vec(Topx), rv_vec(L2x), Botx];
   Lensy = [L1y rv_vec(Topy), rv_vec(L2y), Boty];

   % Parameters for graphing
   Lens_color  = [204, 226, 239]/256;
   Lens_border = 0.3*[1, 1, 1];
   lbw = 1.3; % lens border width
   wavefr_color = [1, 0, 0];
   wavefr_bdw   = 2;
   
   % spacing between wavefronts (both plane and spherical ones)
   spacing = 0.25;

   % 2*H is the height of the plane wavefronts
   H = L1y(N); 

   % theta2 = slope of the line going from the upper-right
   % end of the lens to the focus point
   theta2 = atan(L1y(N)/(f-L1x(N)));

   % Shape of the spherical wavefronts.
   Theta = linspace(-theta2, theta2, N);
   X = -cos(Theta);
   Y =  sin(Theta);

   S = -f; % start ploting waves from here to the right

   % number of frames in the movie
   num_frames = 10;
   Shifts = linspace(0, spacing, num_frames+1);

   % start at S+shift, plot the wavefronts
   for frame_no = 1:num_frames

      shift = Shifts(frame_no);
      
      s = S+shift;

      % plotting window
      figure(1); clf; hold on; axis equal; axis off;

      % plot the plane wavefronts
      while s < 0
         plot([s, s], [-H, H], 'color', wavefr_color, 'linewidth', wavefr_bdw);
         s = s + spacing;
      end
      
   
      % plot the spherical wavefronts
      s = s - 10*spacing; % backtrack a bit
      while s < f
         
         rho = f-s;
         
         if rho*Y(N) <= L1y(N)
            plot(rho*X+f, rho*Y, 'color', wavefr_color, 'linewidth', wavefr_bdw);
         end
         
         s = s + spacing;
         
      end

      % plot the lens
      fill(Lensx, Lensy, Lens_color, 'EdgeColor', Lens_border, 'LineWidth', lbw);
%      get(H)
%      return
      
      % Invisible points to force MATLAB to keep the
      % plotting window fixed.
      tiny = 0.15*spacing;
      white = 0.999*[1, 1, 1];
      plot(S-tiny,   H+tiny, 'color', white);
      plot(S-tiny,  -H-tiny, 'color', white);
      plot(f+tiny,   H+tiny, 'color', white);
      plot(f+tiny,  -H-tiny, 'color', white);

      % Rotate by 90 degrees
      set(gca, 'View', [90, 90])

      % save current file
      frame_file = sprintf('Frame%d.eps', 1000+frame_no);
      disp(frame_file);
      saveas(gcf, frame_file, 'psc2');
      pause(0.07)
   end

% The frames were converted to a movie with the command
% convert -antialias -loop 10000  -delay 8 -compress LZW Frame100* Lens_and_wavefronts.gif
   
function W = rv_vec(V)

   K = length(V);

   W = V;
   for i=1:K
      W(i) = V(K-i+1);
   end

Kuvatekstit

Lisää yhden rivin pituinen kuvaus tästä tiedostosta
Siingleline

Kohteet, joita tässä tiedostossa esitetään

esittää

24. marraskuu 2007

image/gif

Tiedoston historia

Päiväystä napsauttamalla näet, millainen tiedosto oli kyseisellä hetkellä.

PäiväysPienoiskuvaKokoKäyttäjäKommentti
nykyinen25. marraskuuta 2007 kello 09.35Pienoiskuva 25. marraskuuta 2007 kello 09.35 tallennetusta versiosta183 × 356 (35 KiB)Oleg Alexandrovtweak
24. marraskuuta 2007 kello 07.10Pienoiskuva 24. marraskuuta 2007 kello 07.10 tallennetusta versiosta171 × 356 (33 KiB)Oleg Alexandrovtweak
24. marraskuuta 2007 kello 07.09Pienoiskuva 24. marraskuuta 2007 kello 07.09 tallennetusta versiosta171 × 356 (33 KiB)Oleg Alexandrovtweak
24. marraskuuta 2007 kello 03.56Pienoiskuva 24. marraskuuta 2007 kello 03.56 tallennetusta versiosta171 × 359 (33 KiB)Oleg Alexandrovtweak, same license
24. marraskuuta 2007 kello 03.53Pienoiskuva 24. marraskuuta 2007 kello 03.53 tallennetusta versiosta171 × 359 (32 KiB)Oleg Alexandrovtweak
24. marraskuuta 2007 kello 03.49Pienoiskuva 24. marraskuuta 2007 kello 03.49 tallennetusta versiosta151 × 359 (31 KiB)Oleg Alexandrov{{Information |Description=Illustration of wavefronts after passing through a [:en:lens (optics)|lens]] |Source=self-made with MATLAB |Date=~~~~~ |Author= Oleg Alexandrov |Permission=see below |other_versions= }}

Seuraava sivu käyttää tätä tiedostoa:

Tiedoston järjestelmänlaajuinen käyttö

Seuraavat muut wikit käyttävät tätä tiedostoa:

Näytä lisää tämän tiedoston järjestelmänlaajuista käyttöä.